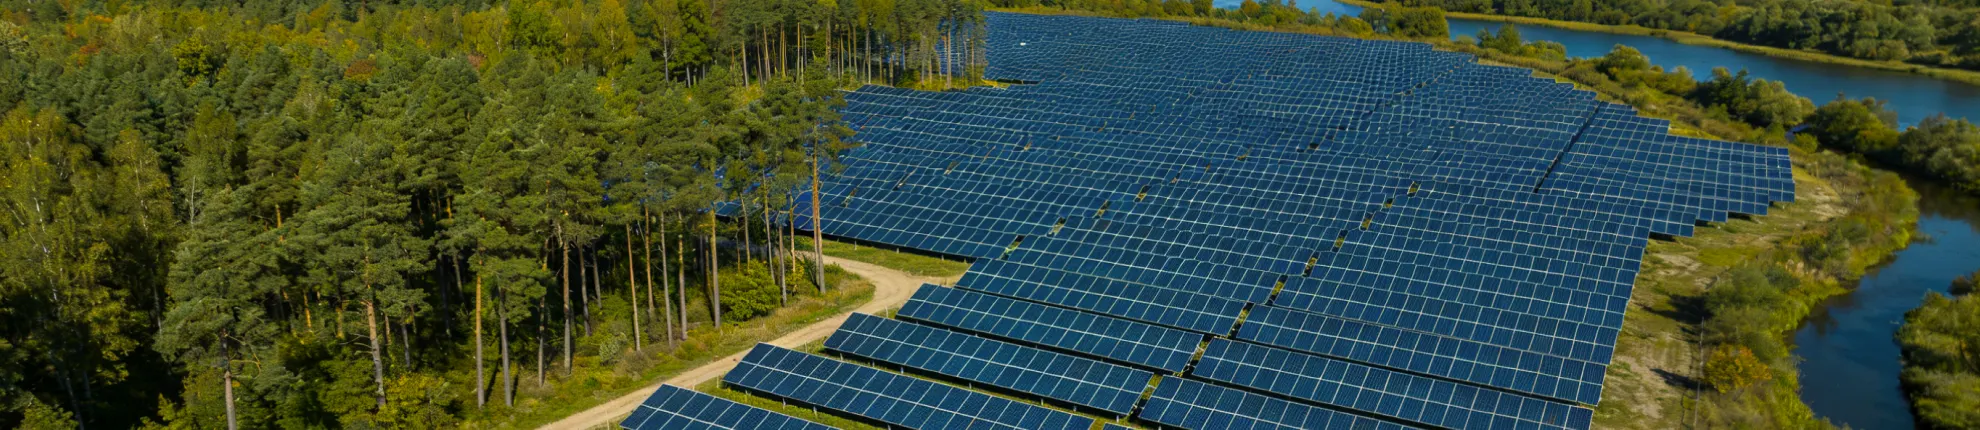
Why Floating Solar Can Outperform Ground-Mounted PV
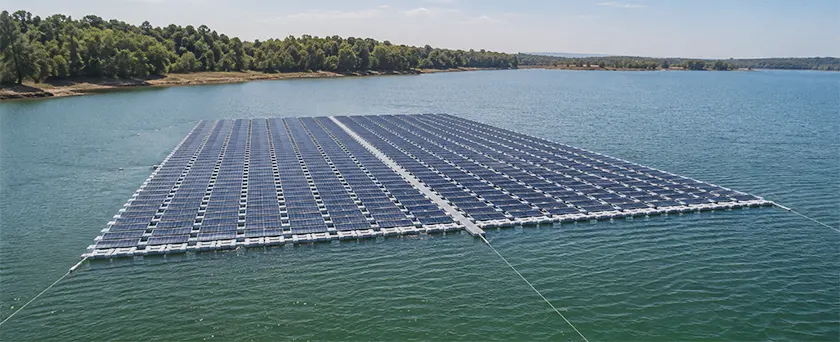
Floating solar often runs in a cooler environment than ground-mounted PV, though the water body alone does not decide whether a floating plant produces more energy. On a real project, the figure that matters is the thermal gain left once every other loss has been counted.
Floating solar can deliver a higher specific yield or performance ratio than ground-mounted PV when the water-surface microclimate reduces module temperature and the mounting structure leaves enough space for rear ventilation. The result is specific to the site and the system design. Low tilt, restricted airflow, wave-induced mismatch, soiling, and lower availability can reduce or cancel the thermal gain.
Table of Contents
Does Floating Solar Really Generate More Energy?
Floating solar can produce more electricity per unit of installed capacity. That does not mean every floating plant will outperform a ground-mounted array, and total generation on its own does not prove a performance advantage.
A larger plant produces more energy because it has more capacity. A higher-efficiency module can increase output from the same module area, but it does not isolate the operating effect of the floating environment. Four metrics come up when floating photovoltaic (FPV) systems and ground-mounted PV are compared, and each one measures something different.
| Metric | What It Measures | Main Limitation |
|---|---|---|
| Total annual generation | Electricity delivered by the entire plant | Strongly affected by project capacity |
| Module efficiency | The percentage of incident solar energy converted into electricity under specified conditions | Does not describe annual plant losses |
| Specific yield | Annual AC energy delivered per unit of installed DC capacity, usually kWh/kWp/year | Requires the same time period and capacity basis |
| Performance ratio | Energy delivered relative to measured plane-of-array irradiance and installed capacity | Depends on irradiance measurement, system boundaries, and data quality |
IEC 61724-1:2021 defines the last two. It refers to specific yield as final system yield, reported in kWh/kWp. Performance ratio divides final yield by reference yield. It reflects the combined effect of temperature, shading, electrical losses, and, depending on how downtime periods are filtered, plant availability.
The standard also defines a temperature-corrected performance ratio. Uncorrected PR carries the cooling benefit along with every other loss. The corrected version shows whether a performance difference remains once the temperature effect is removed, and comparing the two helps distinguish the thermal gain from other losses.
Yield Comparisons Depend on the Reference System
Every published uplift is measured against something, and the choice of reference changes what the number means. Research trials use identical modules, equal DC capacity, similar tilt angles, and sensors close to both arrays, which isolates the cooling effect and explains why a difference appears. Commercial feasibility studies compare two buildable designs that may differ in tilt, row spacing, support structure, cable route, maintenance plan, and site constraints. They show whether the performance difference still holds in a complete design.
Boundaries matter as much as the numbers. If one array is measured with water-surface irradiance data and the other is modeled from a weather station some distance away, the two datasets cannot be compared until the measurement conditions have been reconciled. Part of the apparent gain in your comparison may otherwise come from orientation, resource data, downtime, or measurement uncertainty.
When a supplier or a consultant presents a yield uplift, ask three things:
- Where the irradiance data came from, and under what sensor conditions.
- How the reference system was built.
- What availability assumption was applied to both cases.
Published Yield Gains Are Site-Specific
Crystalline modules lose a small, fixed share of power for every degree of cell temperature rise, a rate listed on the datasheet as the Pmax temperature coefficient. Field measurements confirm that floating PV can run cooler. They do not support a single uplift percentage that applies to every project.
Researchers from TNO and the Solar Energy Research Institute of Singapore compared irradiance-weighted module temperatures at a temperate site in the Netherlands and a tropical site in Singapore, publishing the results in Solar Energy in 2021. The best floating configurations ran cooler at both sites, with a much larger difference in Singapore.
Best-performing floating configurations, irradiance-weighted module temperatures. Yield gains modeled in PVsyst from the measured temperature differences and fitted heat-loss coefficients. Source: TNO and SERIS, Solar Energy, 2021.
The Singapore figures use a rooftop array as the reference. They show how large the cooling effect can be in a tropical climate and say less about how floating PV compares with ground-mounted PV. Both yield gains work as benchmarks for those study conditions. They are not a forecast for your site, where the climate, float design, and reference array will differ.
Across a much larger set of systems, the 2025 IEA PVPS review of floating PV plants, published by Task 13 as report T13-31, found a wider spread. Some floating systems ran cooler than nearby ground-mounted references. Others showed little difference or operated at higher temperatures. Mounting geometry and local weather accounted for much of the variation.
How Float and Support Design Shapes the Cooling Benefit
Two arrays on the same reservoir can run at different temperatures. A raised frame leaves room for air to move beneath the modules. Broad molded floats, walkways, and closely spaced structural members restrict that airflow.
Footprint here means the share of water surface under and around the modules that floats and supports cover. The Task 13 review found that large-footprint structures dissipated heat less readily than open arrangements, and several of them operated at higher temperatures than well-ventilated ground-mounted references.
Rear Ventilation Depends on the Whole Array
The visible gap beneath a module is only part of the ventilation path, because air also has to travel through the array before it reaches the internal rows.
The path depends on:
- Vertical clearance between the modules and the float surfaces
- Structural members directly beneath the modules
- Open passages between rows
- Walkway location
- Prevailing wind direction and the distance air travels before reaching internal modules
Module frames, tilt angles, and float geometry let more air through from some wind directions than others. Measurements from one FPV system in the same review showed different fitted heat-loss behavior under front and rear winds, so array orientation and site wind direction affect both temperature and yield assumptions.
Opening the structure usually improves cooling. It can also raise wind exposure and change the structural requirements and maintenance access. The clearance you choose is an input to both the thermal model and the structural load cases.
Tilt and Float Footprint Affect More Than Irradiance
Tilt angle changes the solar energy reaching the module plane and the loads carried by the floats and the station-keeping system (the mooring and anchoring arrangement that holds the array in position). It also has a large influence on water-surface power density, meaning the capacity you can install per hectare of water.
A broad molded float supports dense module packing while blocking some rear airflow. Because the float body itself carries the load, its material qualification and long-term UV resistance become part of the structural design. DNV-ST-C108 sets out requirements for both. An open frame carried by floats or pipes lets more air through, and the frame members carry a larger share of the structural load.
The table below compares the main heat-transfer paths. It does not rank the architectures.
| FPV Architecture | Main Cooling Path | Main Energy-Yield Consideration |
|---|---|---|
| Molded-float or pontoon system | Air convection around modules mounted on molded floats | Rear obstruction, low tilt, and dense float coverage |
| Metal or fiber-reinforced polymer frame carried by floats or pipes | Air convection through an open support frame | Module clearance, structural height, stiffness, and wind loading |
| Membrane or water-coupled system | Heat transfer through air and, in some systems, through the membrane toward the water | Water temperature, membrane contact, low tilt, and wave response |
Heat-loss coefficients vary within each architecture, because geometry, climate, sensor placement, wind treatment, and the thermal equation all feed the fitted value. Your project model needs a coefficient from a similar design or from site measurements.
What Can Offset Floating Solar’s Yield Gains?
A lower module temperature is one term in the annual energy balance. Tilt, wave-induced mismatch, and soiling can each offset part of that gain. A floating array can run cooler than a ground-mounted reference and still show no net yield advantage at the meter.
Low Tilt Changes Irradiance, Drainage, and Array Density
Commercial FPV systems often use lower tilt angles than ground-mounted arrays at the same latitude. A low tilt casts shorter shadows, so rows can sit closer together, and the array fits more capacity into a defined water area at a lower structural height. That matters when permits or the reservoir function fix the usable water surface.
At higher latitudes, a low-tilt array collects less annual irradiance than it would at the optimum angle. Rain runs off more slowly, so debris clears less readily and bird droppings or organic material stay on the glass longer. Low tilt also narrows how much of the surroundings the rear cells of a bifacial module can see.
A steeper tilt can improve irradiance capture and drainage at some sites, but it also increases wind uplift, row spacing, structural loads, and mooring demand. Feasibility studies commonly compare several tilt cases before fixing the layout, because the energy model tends to favor a steeper angle while the structural calculation and the usable water area favor a lower one.
Waves Create Irradiance and Mismatch Losses
Wind, waves, currents, and changing water levels move the floating structure. Float dimensions, the stiffness of the float-to-float connectors, mooring restraint, and the number of modules carried by each structural unit control how that movement is distributed.
A rigid array that moves as one unit shifts its average plane-of-array irradiance relative to a fixed reference. Smaller floats that move independently tend to produce larger differences in instantaneous tilt and azimuth, and modules in the same circuit then receive different irradiance.
Uneven motion creates wave-induced mismatch. In a series string, the module with the lowest current, usually the least-irradiated one, limits the string current, unless module-level power electronics let each module run at its own maximum power point. The size of that loss depends mainly on three factors: the wave climate at the site, the structural response described above, and the electrical layout, meaning string length and how strings are grouped across MPPT inputs.
Wave-induced losses may be small on a calm inland reservoir. A modest allowance for them still belongs in the yield model, particularly for membrane or water-coupled systems and for layouts where each module sits on its own float.
Soiling on Water Follows a Different Pattern
Floating arrays may pick up less dust from roads, bare ground, and vegetation work, though being over water does not by itself keep the module surface clean.
Low tilt and bird activity produce concentrated deposits. An opaque bird dropping shades the cells beneath it. If the rest of the string keeps driving current through them, those cells can be pushed into reverse bias and form a local hot spot. Pollen, leaves, organic matter, spray, salt, and industrial emissions add to the cleaning load.
Reservoir water can be used for cleaning only when its quality is suitable, since suspended solids, algae, and dissolved minerals leave their own residue on the glass. Access routes and isolation points are settled at the layout stage. Cleaning equipment, work procedures, and a plan for runoff or wastewater belong to the O&M scope.
When Floating Solar Is the Better Choice
Floating solar becomes the better choice when its land, grid, and energy benefits outweigh the added cost of floats, water-based installation, and O&M over the project life. A cooler module alone does not settle the decision.
A full project comparison covers net energy yield, land and water use, grid access, construction feasibility, capital expenditure, operating expenditure, reliability, permitting, and environmental constraints. The table sorts those conditions for early screening, comparing a floating plant with a ground-mounted PV (GPV) alternative.
| Project Condition | FPV May Have a Stronger Case | Further Study Is Needed | GPV May Be the Simpler Option |
|---|---|---|---|
| Land availability | Suitable land is scarce, costly, or needed for another use | Both land and water are available | Contiguous, low-cost buildable land is available |
| Thermal environment | Air above the water is cooler during high-irradiance periods | The water-to-land temperature difference is unmeasured | The ground site is already cool and well ventilated |
| Water conditions | Sheltered water has manageable waves and water-level change | Seasonal movement or wave exposure is substantial | Strong waves, currents, or complex shoreline conditions create major design constraints |
| Array design | The structure leaves open airflow and holds module orientation steady | Several layout requirements compete for the same space | Ground mounting permits a more favorable tilt or tracking |
| Grid infrastructure | The water body is close to existing electrical infrastructure or a hydropower facility | Some new interconnection work is still required | The ground site has a shorter or simpler connection route |
| O&M access | Walkways, isolation points, inspection routes, and cleaning access can be planned | Internal areas remain difficult to reach | Ground access is direct |
Many of the uncertainties in the middle column come down to site data. Paired air-temperature measurements over the water and at a nearby ground-mounted site reduce uncertainty in the thermal comparison. Seasonal water-level and wave records, layout and grid studies, and operating data from comparable installations do the same for water conditions, grid connection, and O&M access.
Lifetime electricity production forms the denominator of levelized cost of energy. Higher specific yield lowers LCOE, while floats, connectors, anchors, mooring components, water-based installation, access provisions, and monitoring raise the cost side. FPV reaches a lower LCOE than the ground-mounted alternative only when its percentage gain in lifetime energy is larger than its percentage increase in lifetime cost, with both calculated on the same financial assumptions.
None of the conditions in the table decides the project on its own. FPV has the stronger case when the water body resolves a real land or infrastructure constraint, the site produces a measurable thermal benefit, and the waves, water levels, and maintenance access all stay within a practical design range. A site-specific techno-economic assessment, run with the added losses and costs included, shows whether FPV keeps its advantage under the project’s own assumptions. Permitting and environmental approval remain separate conditions.
Custom System Design for Floating Solar Projects
Mibet designs project-specific floating solar systems around the environmental and operating conditions of each water body. Using your module specifications, target DC capacity, water-level range, wind and wave conditions, and site boundaries, our engineering team optimizes module tilt, float layout, mooring arrangement, and maintenance access as part of the overall project design.
Send your target capacity, module specifications, water-body conditions, and site boundary to our engineering team for a project-specific floating PV layout and mooring review.
Frequently Asked Questions
1. Can bifacial modules increase floating solar energy yield over water?
Bifacial modules add rear-side energy, though open water reflects far less light than bright soil or gravel. At the high sun angles that deliver most of the annual yield, the bulk of the incident light passes into the water, and little of it comes back toward the module rear.
A monitored research installation on a Dutch pond, reported by TU Delft in Progress in Photovoltaics, measured an effective albedo of roughly 6.5% for inland water, and the researchers concluded that floating bifacial systems need reflectors for the rear side to add much energy. On a standard FPV layout with no reflectors, the rear-side gain depends mostly on module tilt, mounting height, and how much of the water behind the modules the floats and walkways block.
2. Can floating solar be installed on reservoirs with large water-level changes?
Yes, provided the station-keeping system and the electrical cables accommodate the full operating and extreme water-level range.
The design has to account for mooring geometry, line length and tension, anchor position, shoreline connections, cable slack, and maintenance access across every water level your reservoir actually reaches, as well as the rate of water-level change. The relevant operating and extreme levels feed into the station-keeping load cases, and DNV-ST-E309 sets out how to derive mooring loads and load combinations for FPV systems.
3. Is floating solar suitable for coastal or offshore waters?
Some FPV technologies operate in sheltered nearshore locations, and offshore concepts are in development. Inland-reservoir design assumptions do not carry across.
Offshore, stronger waves and currents add fatigue loading, salt exposure speeds up corrosion, seabed conditions complicate anchoring, and cables, access, and emergency procedures all need more planning. Those conditions call for marine engineering methods and a design basis built for that environment.
4. Does high humidity cancel the cooling benefit of floating solar?
No. Humidity alone does not remove the thermal benefit. Module temperature still follows irradiance, air temperature, wind, mounting geometry, and the heat-transfer path.
Humidity matters more to long-term reliability than to the short-term cooling effect. Persistent moisture contributes to corrosion, insulation problems, and material degradation, and those risks are assessed with their own data, separate from the thermal model.
5. How much of a reservoir can a floating solar system cover?
No single coverage percentage applies to every reservoir. The usable area depends on the reservoir function, environmental limits, intake structures, navigation, shoreline setbacks, water-level variation, wave exposure, maintenance corridors, permits, and grid capacity.
Regional and global potential studies, such as the World Bank floating solar market report, apply assumed coverage ratios to estimate technical potential. Those ratios support resource mapping, and they are not project-design limits. The final layout is set by site-specific environmental, operating, and engineering studies.
Here is a list of the sources used to create this article.
- IEC 61724-1:2021, Photovoltaic system performance – Part 1: Monitoring. IEC, 2021.
- Dörenkämper et al. The cooling effect of floating PV in two different climate zones. Solar Energy 214, 2021.
- IEA PVPS Task 13. Floating PV Power Plants: A Review of Energy Yield, Reliability, and Maintenance. T13-31, 2025.
- DNV-ST-C108, Structural design of floats for floating photovoltaic systems. DNV, 2026.
- Ziar et al. Innovative floating bifacial photovoltaic solutions for inland water areas. Progress in Photovoltaics, 2021.
- DNV-ST-E309, Station keeping of floating solar photovoltaic systems. DNV, 2026.
- World Bank, ESMAP and SERIS. Where Sun Meets Water: Floating Solar Market Report, 2019.
Tao Chen
Marketing Director & IT Director · MIBET ENERGY
MIBET is a global designer and manufacturer of solar mounting systems. With over 10 years of professional experience, Tao Chen regularly contributes articles to our blog on structural design, installation, and maintenance, offering valuable guidance for navigating the complexities of solar projects.